Introduction: A Field Test at Dawn, a Price Spike, and a Hard Question
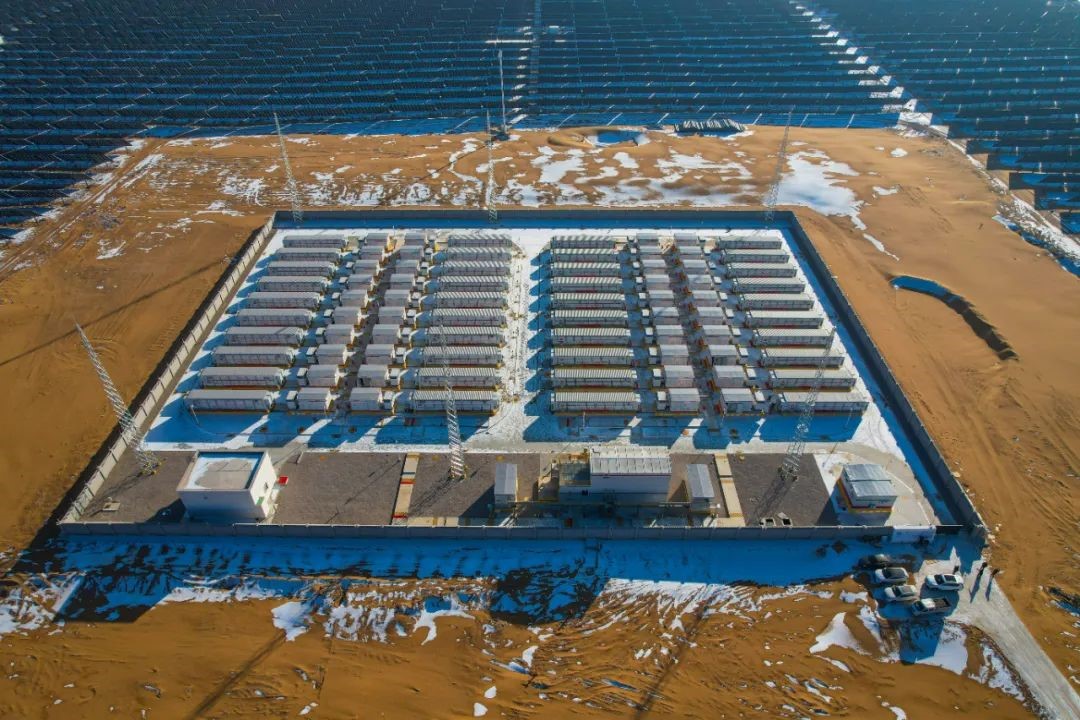
I’ve spent over 17 years wrangling big iron and bigger contracts from Midland to McCamey, and I still remember a cold dawn near Pecos County when the meter spun like a top and ERCOT prices jumped. Utility scale battery storage was the only thing standing between us and a nasty curtailment. I was on-site with a commissioning crew, eyes on a 100 MW yard, and I kept asking myself: are we measuring the right things, or just the loud ones? I mean the actual payoff of utility scale battery storage systems, not the glossy dashboard numbers.
That morning, a tight 2‑second frequency event clipped our reserve, wind output dipped, and the dispatch turned on a dime. The battery hit the setpoint in under 150 ms—good news—but our HVAC parasitic load rose 8% because the racks were running hot after a long discharge. The data was telling a story; it wasn’t the one the sales deck promised. So here’s my question, plain and simple: what should a utility asset manager or EPC actually compare to decide which system pays back in the real world? (Look here, partner—this ain’t my first rodeo, but I still like a straight answer.) Let’s stack the old way against the new and see what really adds up.
Where the Old Playbook Falls Short
What’s tripping folks up?
Let me shoot straight. The traditional approach measured nameplate power and round‑trip efficiency, then called it a day. That misses the hidden losses that eat your margin. I’ve watched BMS limits get set conservatively, shaving 6–8% off usable capacity for months because no one updated the SOC calibration after a firmware change—March 2022, Reeves County, and yes, we fixed it before summer. SCADA polling at 4‑second intervals? That’s a lifetime when your power converters need sub‑second signals for frequency response. And single‑setpoint EMS logic will overshoot in a mixed renewables node. It’s not sabotage. It’s just the old metrics are too blunt for today’s dispatch.
Another blind spot: thermal. If your rack‑to‑rack delta runs over 7°F for long stretches, expect uneven aging and surprise downtime. I saw a 3.45 MWh container lose 12% effective capacity in one quarter because the airflow path was blocked by a misrouted fiber tray—ridiculous, and preventable. Diesel peakers used to soak these hiccups; now it’s on the battery. C‑rate claims also mislead. A 1C sticker means nothing if your inverter clipping and feeder limits choke you to 0.6C in the hour that matters. And when the HVAC draws hard in August, round‑trip drops two points. We pretend it’s fine—then bid regulation as if it weren’t. That’s how projects drift red. I’d rather compare reality against reality and stop the bleed.
Proof on the Ground, and What Comes Next
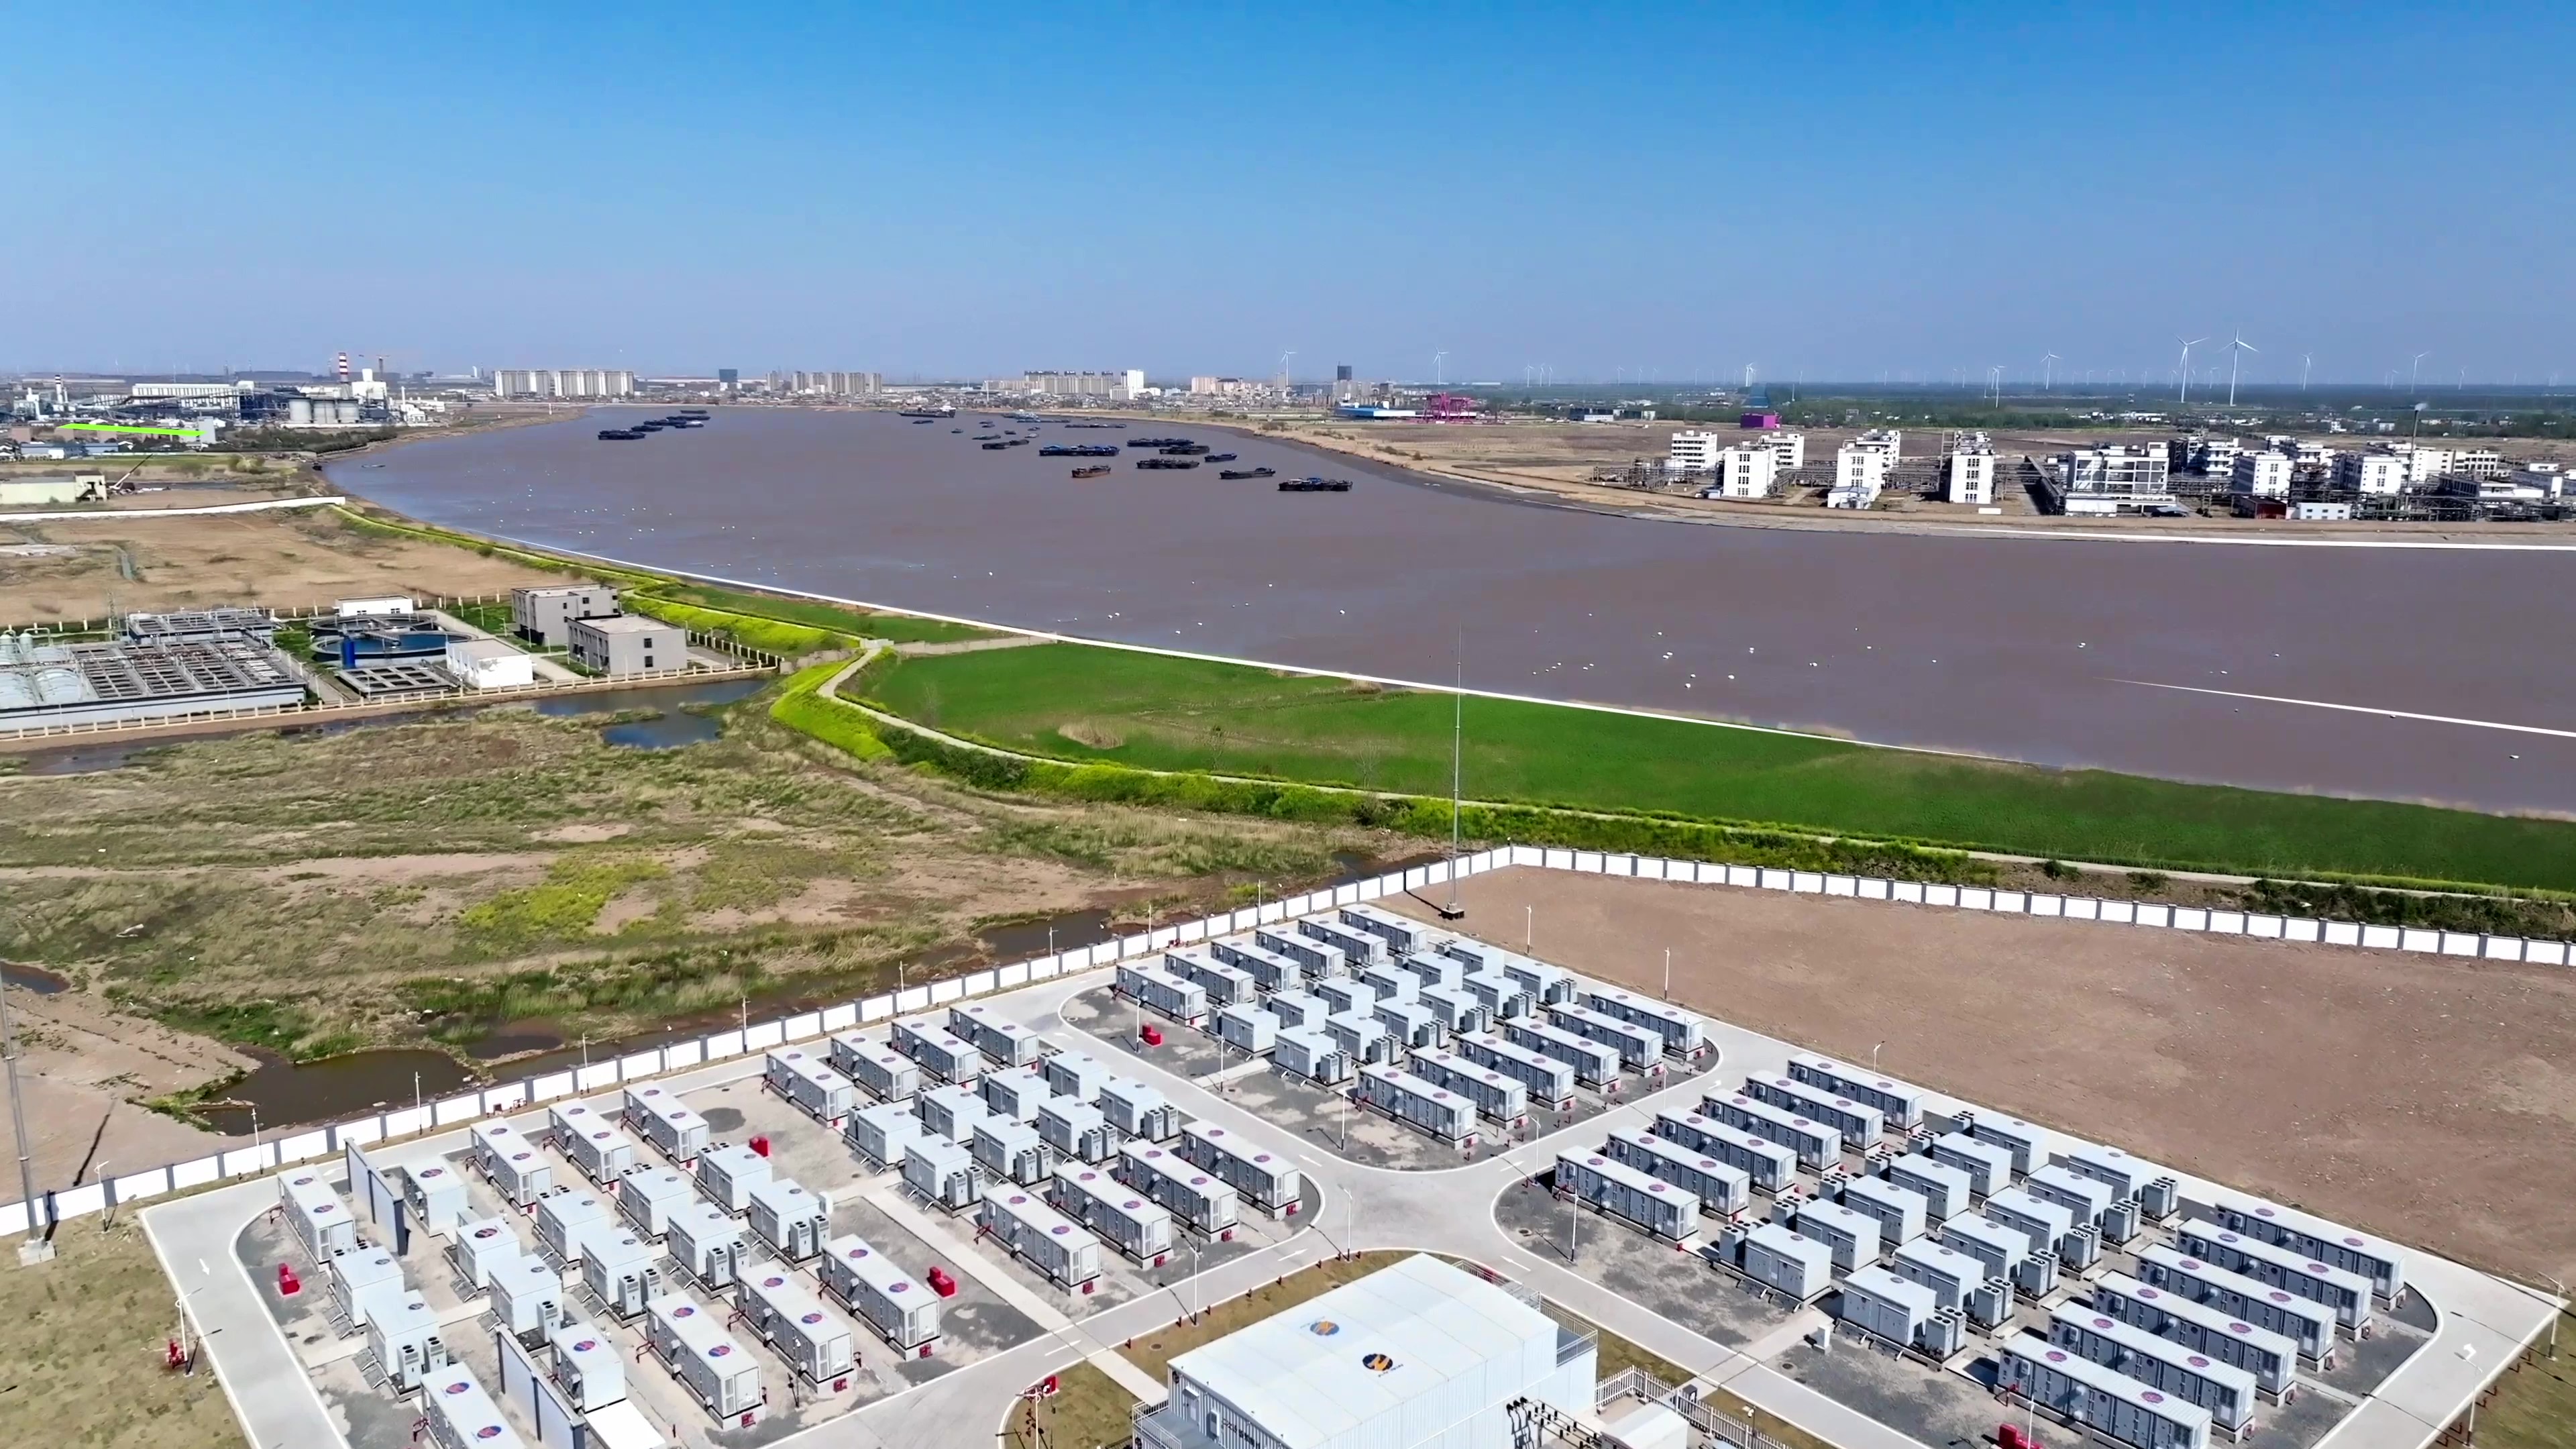
Let me show the comparison that changed my mind. In June 2023, we commissioned a 100 MW / 200 MWh LFP site near Fort Stockton. Two design choices made the difference: tighter liquid cooling on the racks and a faster EMS with edge computing nodes at the inverter skids. Same batteries, same weather, different brain. We cut the thermal spread from 9°F to under 4°F across peak hours—capacity fade slowed, and the C‑rate held steady longer. Frequency response tightened to ~120 ms on average—measured in PMC logs—and we saw a 14% uptick in ancillary revenue through August. Round‑trip efficiency rose about 1.8 points after we trimmed HVAC cycling. Not magic—just better control layers and a cleaner airflow path. The payoff of utility scale battery storage systems gets real when the details stop fighting each other.
Future‑leaning designs are making this easier. DC‑coupled hybrids let you soak midday solar without extra conversion steps, while adaptive BMS curves adjust charge windows when ambient heat spikes. You’ll see fewer forced outages when the EMS respects feeder limits and inverter derates in real time (no more guessing games). I’m bullish on predictive dispatch that ties weather nowcasts to setpoints every five minutes—less yo‑yo, fewer surprises. — I’ll spare you the war stories, mostly. The point is simple: when we compare architectures, we should compare response latency, thermal stability, and control granularity before arguing over another decimal point in LCOS. That’s the grown‑up version of “what pays.” And yes, we measured it twice—once in the lab, once in a dust storm.
What’s Next
Three yardsticks I use when choosing between systems, whether for a co‑op in the Panhandle or a merchant asset in ERCOT South: – Thermal discipline: Track rack‑to‑rack delta over the hottest week; stay under 5°F and log the outliers. If it drifts, expect uneven aging. – Control latency: End‑to‑end EMS to inverter response under 200 ms for frequency service; under 1 s for energy shifting tied to fast solar ramps. Test it during curtailment hours, not on a calm Sunday. – Real net efficiency: Include HVAC parasitics and feeder losses over a full 24‑hour summer profile; if you don’t, your LCOS lies by 2–3 percentage points. I’ve learned these the hard way, from a February 2021 freeze to an August 2023 heat dome. We owe our teams a fair comparison, not a pretty spreadsheet. If you keep those yardsticks tight, the rest tends to follow—bankability, uptime, and fewer 3 a.m. callouts. For more perspective from a manufacturer’s bench, I keep an eye on HiTHIUM—quietly useful, and that’s what I need.